Universities and courses
Build exercises around line excitation, crystal resolution, higher-order interference, and the influence of PHA settings.
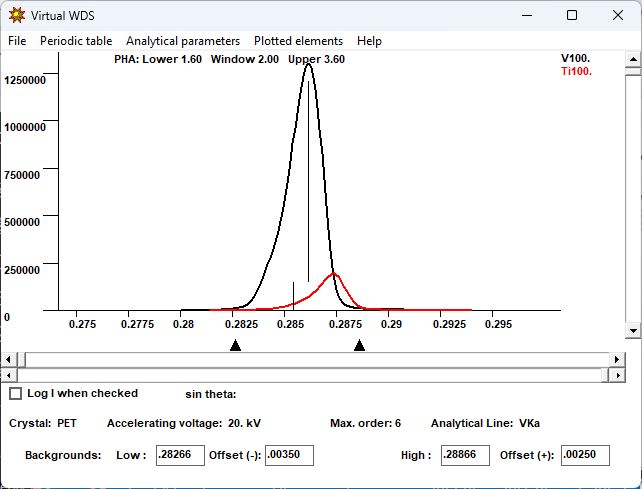
Example / Vanadium with titanium
The vanadium Kα profile and a nearby titanium contribution are displayed separately on PET at 20 kV. Their proximity makes this a useful starting point for examining interference at the analytical peak and the choice of background positions.
Who uses it
Build exercises around line excitation, crystal resolution, higher-order interference, and the influence of PHA settings.
Evaluate candidate analytical lines and backgrounds with users, and document the reasoning behind spectrometer and counting choices.
Investigate how changing matrix composition affects spectral interferences and background selection for a proposed method.